
Find creators
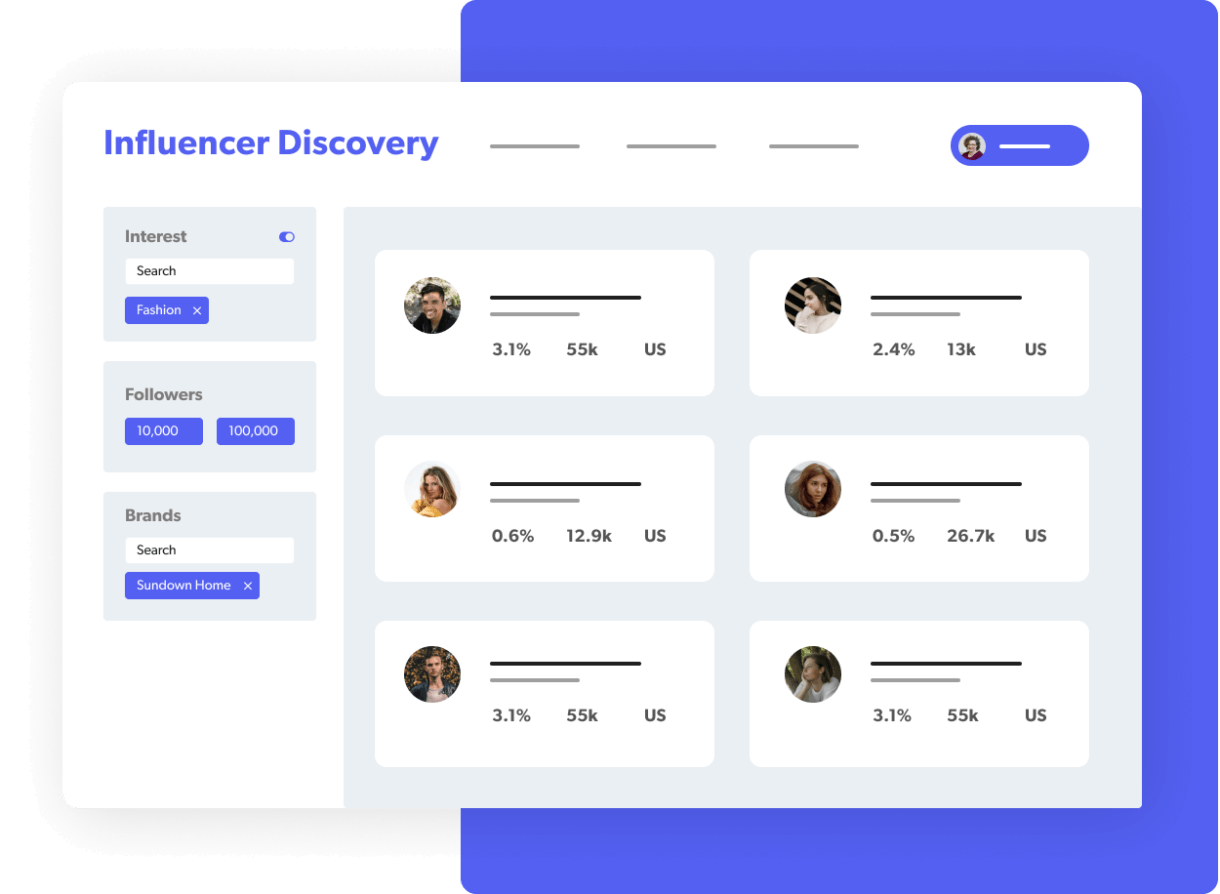
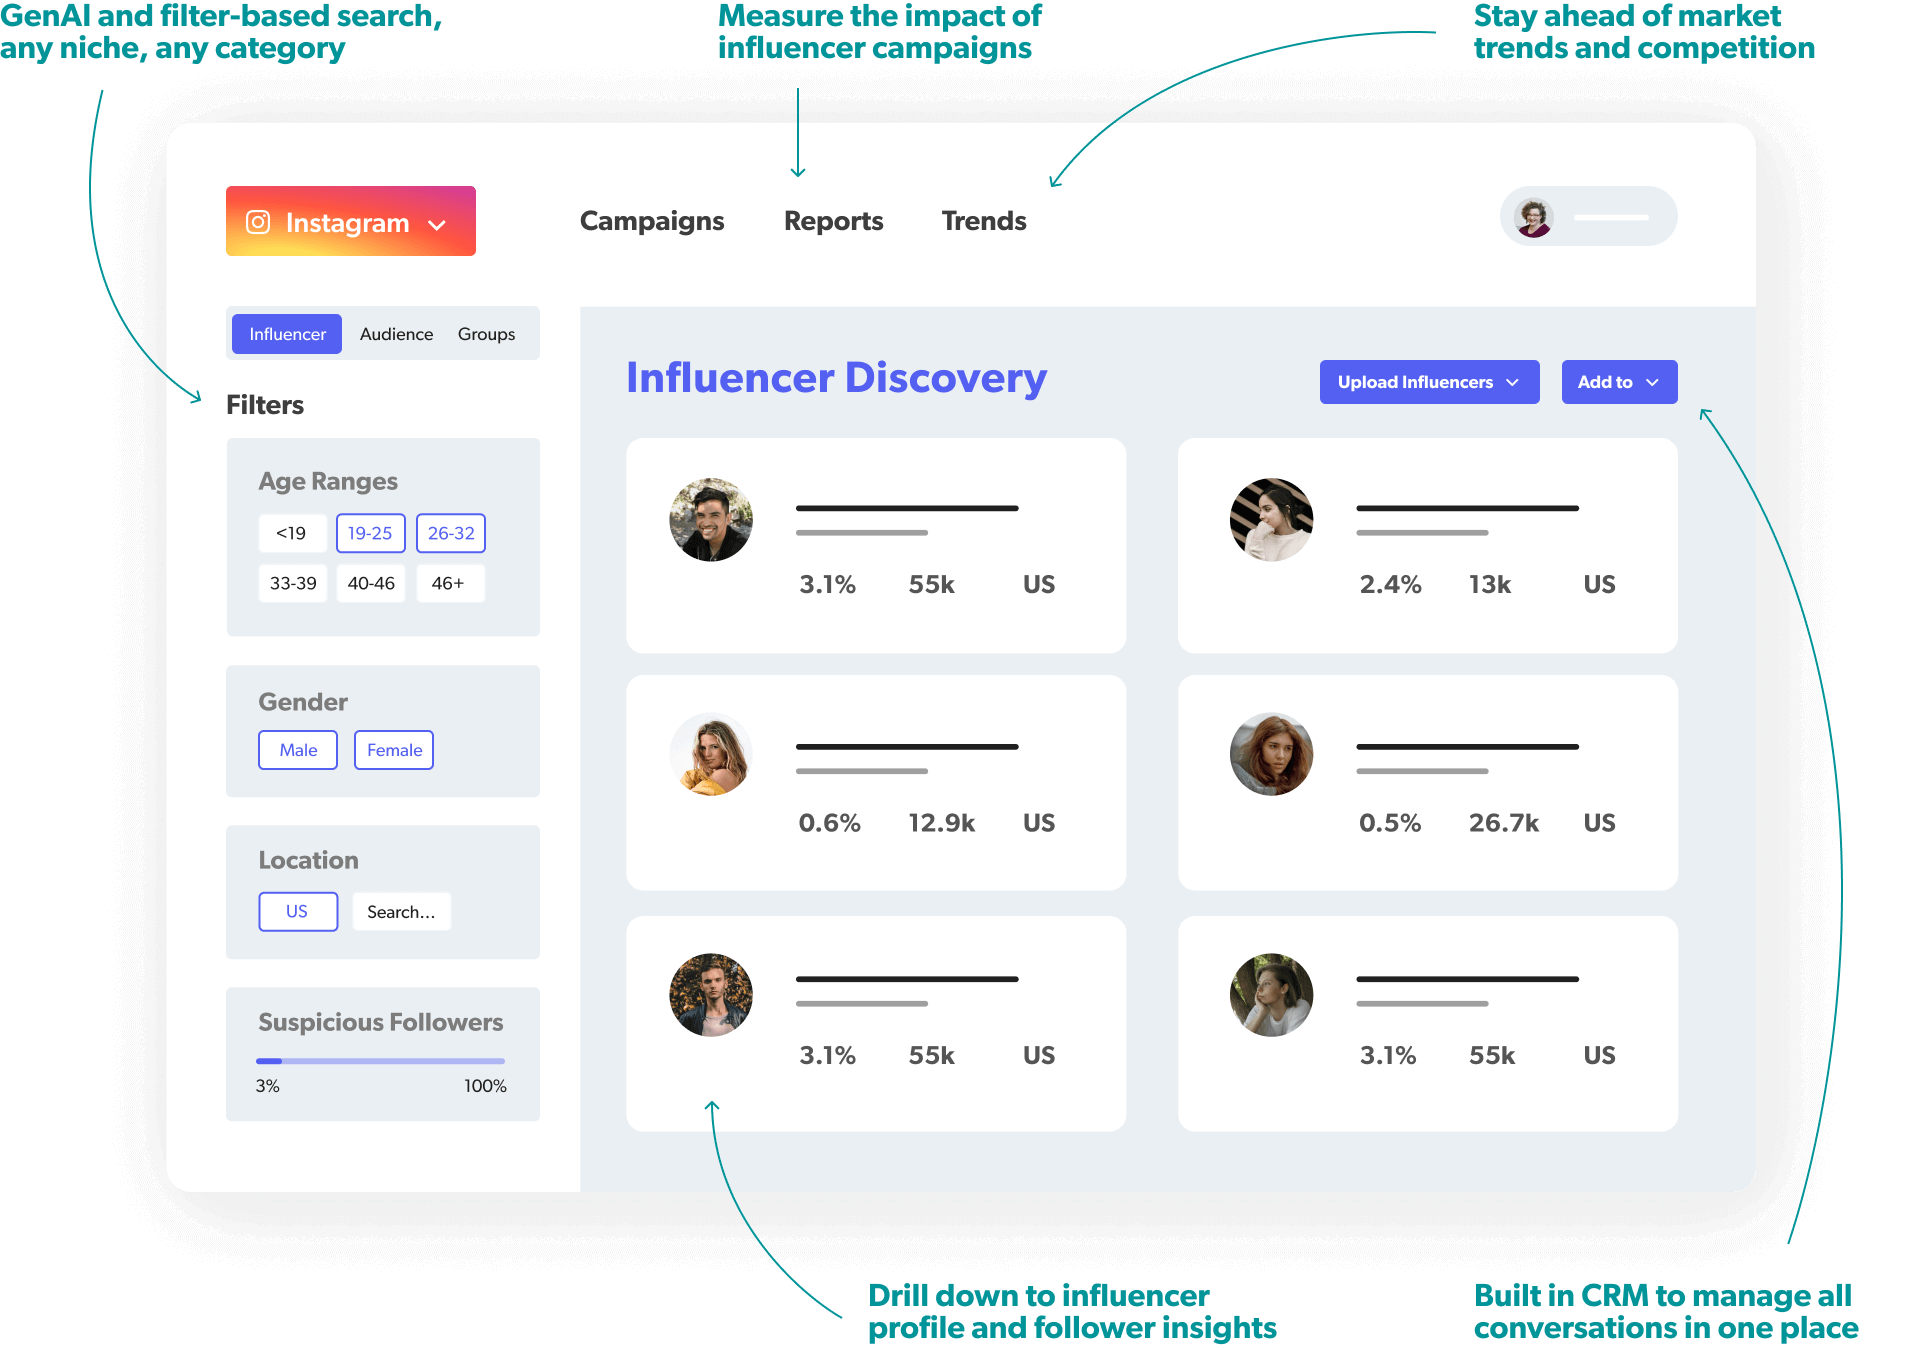
Discover creators with real influence and relevance using industry-leading Generative AI and advanced filters.
The affable.ai platform is now part of the Bazaarvoice solution
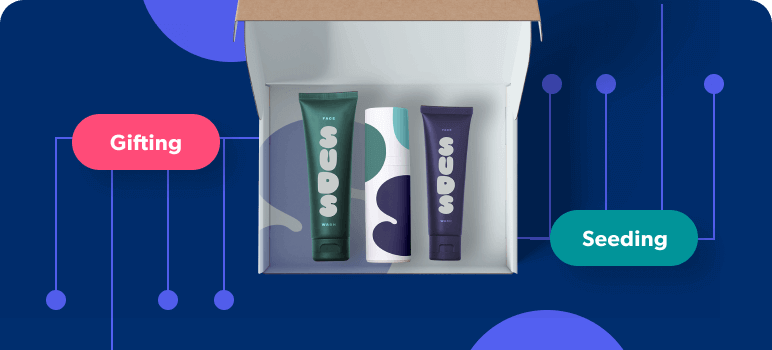
As the creator economy takes off, one thing is true: Shoppers trust each other more than they trust what a brand says. Content creators of all sizes on social media are the driving force behind that growth in trust, but with diverse types and areas of expertise, finding the perfect creator who authentically resonates with your consumers is the challenge. The affable.ai platform is now part of the Bazaarvoice solution, the leading technology specializing in AI-driven influencer marketing solutions. Let us help you connect, manage, and measure creator collaborations for your brand.
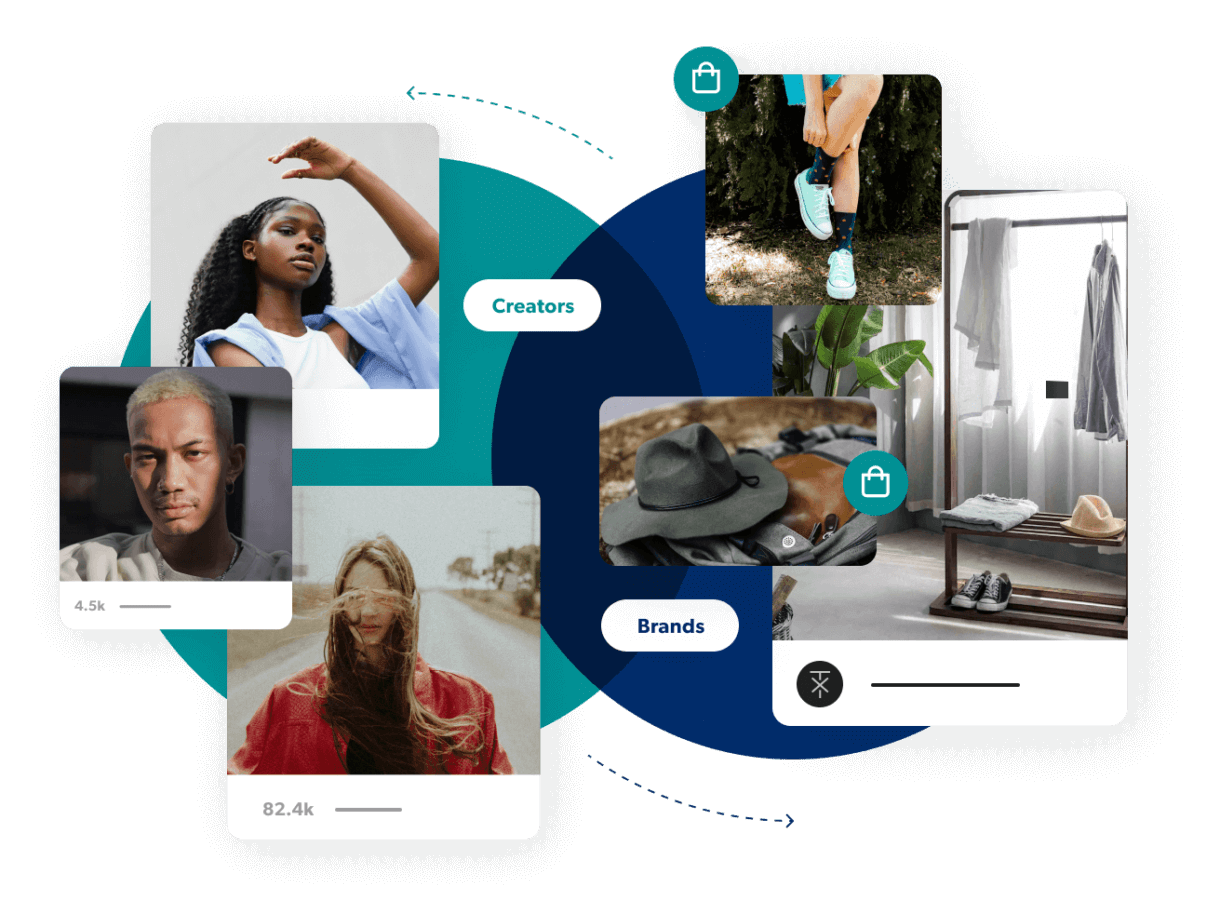
Discover the ideal creators for your marketing strategy with Bazaarvoice affable.ai, our newest solution.
Use 20+ advanced filters or simplify creator search with our GenAI offering with text, mood boards, conversational chat, and lookalike recommendations. Whether you’re looking for a nano creator with followers in the thousands or macro influencers with 250K+ followers, collaborate and manage your creators seamlessly from one place, with an option to skip over any of your competitors’ creators.
Bonus: Explore our creator marketing solutions for agencies – raise your client’s social voice with scalable creator marketing.


We would highly recommend affable.ai for its insights on creators and tracking and reporting capabilities. The process is a lot easier and more convenient in getting details such as engagement rate and reach of creators, which helps us curate our content more efficiently.
Celisse Ng
Marketing Manager, L’Occitane

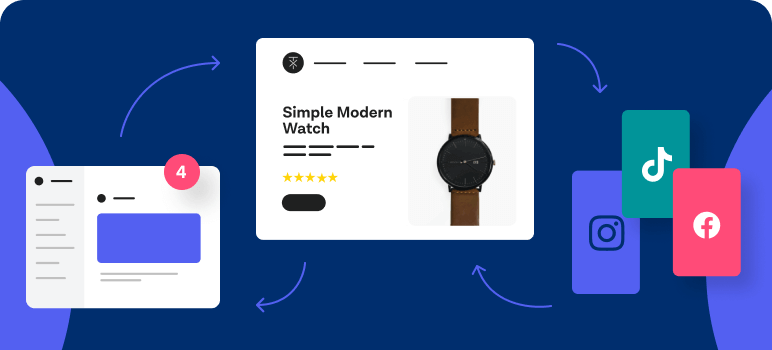
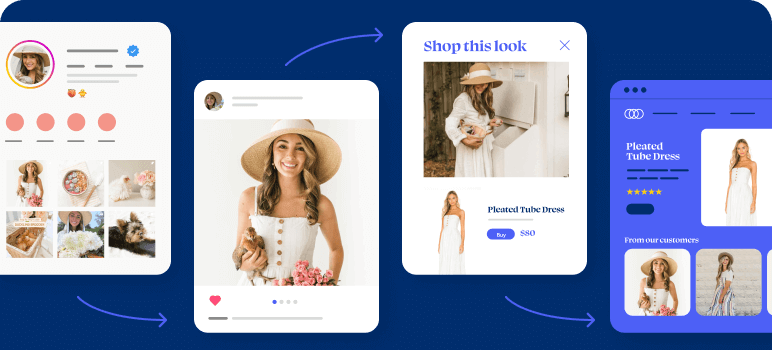
One dashboard to view all the influencer generated content.
Get in touch to find out which solutions will make the most impact for your business. Our helpful sales team can answer your questions and talk about everything from set up to ROI.
Book a call